Portfolio

What I've built, led and learned as a data science student at UC San Diego.

Skills

Also: R, MATLAB, Git, Power Apps and Dataverse.

B.S. Data Science. 4.0 GPA, Provost Honors every quarter.

Coursework

DSC 10, 20, 40A, 40B, 80 and 106 (Data Visualization), MATH 189 (Exploratory Data Analysis and Inference), ECON 120A (Econometrics) and MGT 153 (Information Technology in Business Analytics). Before UC San Diego: linear algebra, multivariable calculus and data structures.

All courses

Data science and statistics

  • DSC 10 Principles of Data Science
  • DSC 20 Programming and Basic Data Structures for Data Science Built an image-processing library and a KNN image classifier in pure Python.
  • DSC 40A Theoretical Foundations of Data Science I
  • DSC 40B Theoretical Foundations of Data Science II Algorithms and runtime analysis: graph search, clustering, nearest neighbors.
  • DSC 80 The Practice and Application of Data Science Final project: the Hawaii restaurant predictor. Also built n-gram language models.
  • DSC 106 Introduction to Data Visualization now This site started as my DSC 106 lab work.
  • MATH 189 Exploratory Data Analysis and Inference now

Economics

  • ECON 1 Principles of Microeconomics
  • ECON 2 Market Imperfections and Policy
  • ECON 3 Principles of Macroeconomics
  • ECON 120A Econometrics A

Business

  • MGT 18 Managing Diverse Teams
  • MGT 103 Product Marketing and Management now
  • MGT 153 Information Technology in Business Analytics now

Research and writing

  • COGS 14A Introduction to Research Methods
  • MCWP 125 Argument and Analysis

Math and CS before UC San Diego

  • MATH 210 · Santa Barbara City College Linear Algebra
  • MATH 200 · Santa Barbara City College Multivariable Calculus
  • CS 108 · Santa Barbara City College Discrete Structures
  • CSCI 2270 · CU Boulder Data Structures C++: linked lists, stacks and queues, trees, graphs and hash tables.
  • CS 106A · Stanford summer session Programming Methodology

Experience

Internships, roles and leadership.

Rebuilding a quarterly construction market report so every number traces back to a real source.

100+

hours of manual work per report, now being automated

300+

data series cataloged across the report's three sections

36

report pages traced, figure by figure, to the original publisher

2

client releases a quarter instead of one, approved by the CEO

CREDE, a development advisory and construction project management firm, sends clients a quarterly market report that answers one question: should I build now? Putting each report together was a manual process that took more than 100 hours. I'm automating it on a repeatable data foundation. I traced every figure in the report to its original publisher, restructured it around the client's question, and built a catalog of 300+ data series that records where each one comes from, how to pull it, how often it's released and exactly what it measures. That catalog is the spec for an Azure platform I co-designed with a fellow intern, approved by the CEO in October. The goal is full automation: an AI drafts each report from the latest data and the firm's past reports, and an employee reviews and approves it before it goes to clients.

1. SOURCES 2. PULL 3. ARCHIVE 4. DRAFT + APPROVE Censusspending, starts FRED / ALFREDrates, history, past versions BLSprice indexes, wages SEC EDGARREIT and builder filings Paid and report-onlysubscriptions, PDFs Python workerruns on a schedule Python workerruns on a schedule Python workerruns on a schedule Python workerruns on a schedule Manual uploadchecked automatically New series: one line of config. New provider: one new worker. Azure Cosmos DB every pull saved with its pulled-on date keeps revision history Past CREDE reportsstyle and structure AI drafts the report from the latest data, in the structure of past reports An analyst reviews edits and approves every draft Client PDFtwo releases a quarter
The planned pipeline. The data platform was approved in October 2026 and is being built. Workers save every pull with its date, because agencies revise their numbers. An AI turns that data into a first draft, and nothing reaches clients until an employee approves it.

Decisions I made

  • Two releases a quarter. Market and cost data come out 2–4 weeks after quarter end, but sector data takes 3–7 weeks. Splitting the report into Current Conditions and Sector Forecast means neither waits for the other, and gives the firm two client touchpoints a quarter instead of one, a win for the marketing team as well as for readers. The CEO approved it in October.
  • Publish our own sector forecast. Many sector forecasts came from firms that compete with CREDE. I designed two methods side by side: build it from supply, demand and price inputs, or take the median and range of other publishers' year-over-year changes.
  • Compare like with like. Each series records what it measures and whose price it is (factory, contractor or retail). Sources are only combined when both match, and only by year-over-year change, never by level.
  • Azure over an all-Power-Platform build. Co-designed with a fellow intern. I compared three options on cost, testing and upkeep. At Microsoft list prices, the Azure option runs about $9–15 a month today, while Dataverse storage costs about $40 per GB a month once the included allowance is used up.

Also at CREDE

I built a monthly reporting layer for the finance team’s forecast model, a Python and Plotly chart prototype, and a corporate card process that imports straight into the new accounting system. I’m now streamlining how projects move through our internal tools, from first lead to final billing, to make the work easier for the whole team.

Stack

Python, pandas, Plotly, openpyxl, REST APIs (FRED, Census, BLS, SEC EDGAR, EIA), Excel, Azure (Cosmos DB, Functions), Power Platform, HubSpot, Sage Intacct.
Connecting founders, investors and student talent across UC San Diego's startup ecosystem.

I'm the day-to-day contact for the startups at UC San Diego Horizon, including room and Studio 411 reservations. I help run investor programming like Meet the VC office hours and CULEX, BOW Capital's pitch day with Horizon startups.

Connections that led somewhere

  • Chakra Tech, a Horizon startup, hired EIEC members I introduced.
  • Invited by the Managing Director to present on student entrepreneurship at BOW Capital's first UC San Diego visit.
  • Introduced a Hybrid Reefs investor to the founder of a consumer brand.

Now: startup data

Since fall 2026 I've worked with Managing Director Shane Moise on Horizon's startup data, filling gaps and supporting milestone reporting with PitchBook and Dimensions.

Finding pirated live-sports streams while the event is still on.

10,000+

Reddit and Telegram posts processed an hour

~300

ranked candidate links surfaced an hour

~50

of the top candidates confirmed as piracy

The problem

During a live UFC card, links to illegal streams spread through Reddit threads and Telegram channels, and most are gone within hours. Rights holders need to find them early and prove what they are. Searching by hand can't keep up, and most shared links are noise: news, highlights, betting promos and spam.

What we built

A pipeline of six Docker services around one PostgreSQL database. Scrapers collect every link shared on Reddit and in 68 Telegram channels. Every two minutes, an investigation engine reads the conversation around each new link and scores it 0 to 100 for urgency. Sixteen headless Chromium crawlers then claim links highest-urgency first, follow them up to two levels deep, and check the page for twelve piracy signals, saving the full click path as evidence.

1. SOURCES 2. INGEST 3. INVESTIGATE 4. CRAWL + DETECT tgstat.compublic channel directory Telegrampublic stream channels Redditevent threads + comments channel_finder.pykeyword search, manual review telegram_engine.pyTelethon, polls every 5 min apify_reddit.pyApify, streamed in batches channel list investigation_engine.py every 2 min, incremental 1. pick best comment/URL 2. build context window Reddit: reply chain Telegram: last 20 msgs 3. score (ranker.py) urgency + likelihood crawl_engine.py4 browsers × 4 contexts Playwright BFS crawlerdepth 2, 10 links/page detector.py5 hard + 7 soft signals POSTGRESQL 16 one schema for every source; doubles as the crawl job queue postsReddit threadssourcesubsource commentsbody, hrefscore (votes/views)investigated_at investigationurgency_scorestream_likelihoodcrawl state, piracy_score crawl_resultslink_chain (JSONB)final_urlpiracy_score upsert msgs new links upsert claim by urgency piracy score evidence Ranked, evidence-backed takedown queue Adminer queries, CSV export for review Docker Compose: 6 services db, telegram_engine, scrape_reddit (on demand) investigation_engine, crawl_engine, adminer
Each stage runs as its own container and talks to the others only through Postgres. Telegram messages are stored as comments, so the scoring code works the same for both sources.

My role

I was Data Lead on a five-person team.

  • Designed the PostgreSQL schema. One data model for every source: posts and comments are tagged with source and channel, so adding a platform means writing a scraper, not changing the ranker. A timestamp on each comment lets the system re-score a link whenever new replies arrive.
  • Built the Telegram ingestion. A Telethon client that polls public channels, pulls the first external link out of each message, and writes it into the shared schema with duplicate-safe batch inserts.
  • Co-designed the urgency score. Intent words in the surrounding conversation ("mirror", "still up"), how many people share the link, engagement, event keywords in the post title and words in the URL itself, minus points for words like "highlights" or "odds". A second score ignores popularity so brand-new links still get checked.
Technical details

Engineering highlights

  • Crawlers claim work with FOR UPDATE SKIP LOCKED and a 90-second lease, so no two grab the same link and no Redis is needed.
  • Piracy pages often flash the stream and then redirect, so detection runs every 500 ms during page load and inspects every pop-up.
  • Video alone proves nothing, so "soft" video signals only count once a "hard" signal fires, such as a piracy ad network or a "Server 1 / Server 2" picker.
  • One SPORT setting switches channels, keywords and allowlists between UFC and the World Cup.

Stack

Python 3.12, PostgreSQL 16, Docker Compose, Playwright, Telethon, Apify, Pydantic, pytest (88 tests).

Went from fellow to president, and launched the club's first Physician-AI Hackathon.

I joined as a QI x EIEC Innovation & Entrepreneurship Fellow (Oct to Dec 2025), working on early-stage commercialization with Qualcomm Institute mentors. That's where the idea for Plaza started. I then mentored the next fellow cohort as Project Manager (Jan to Mar 2026) and led the club as President (Mar to Jun 2026).

Physician-AI Hackathon

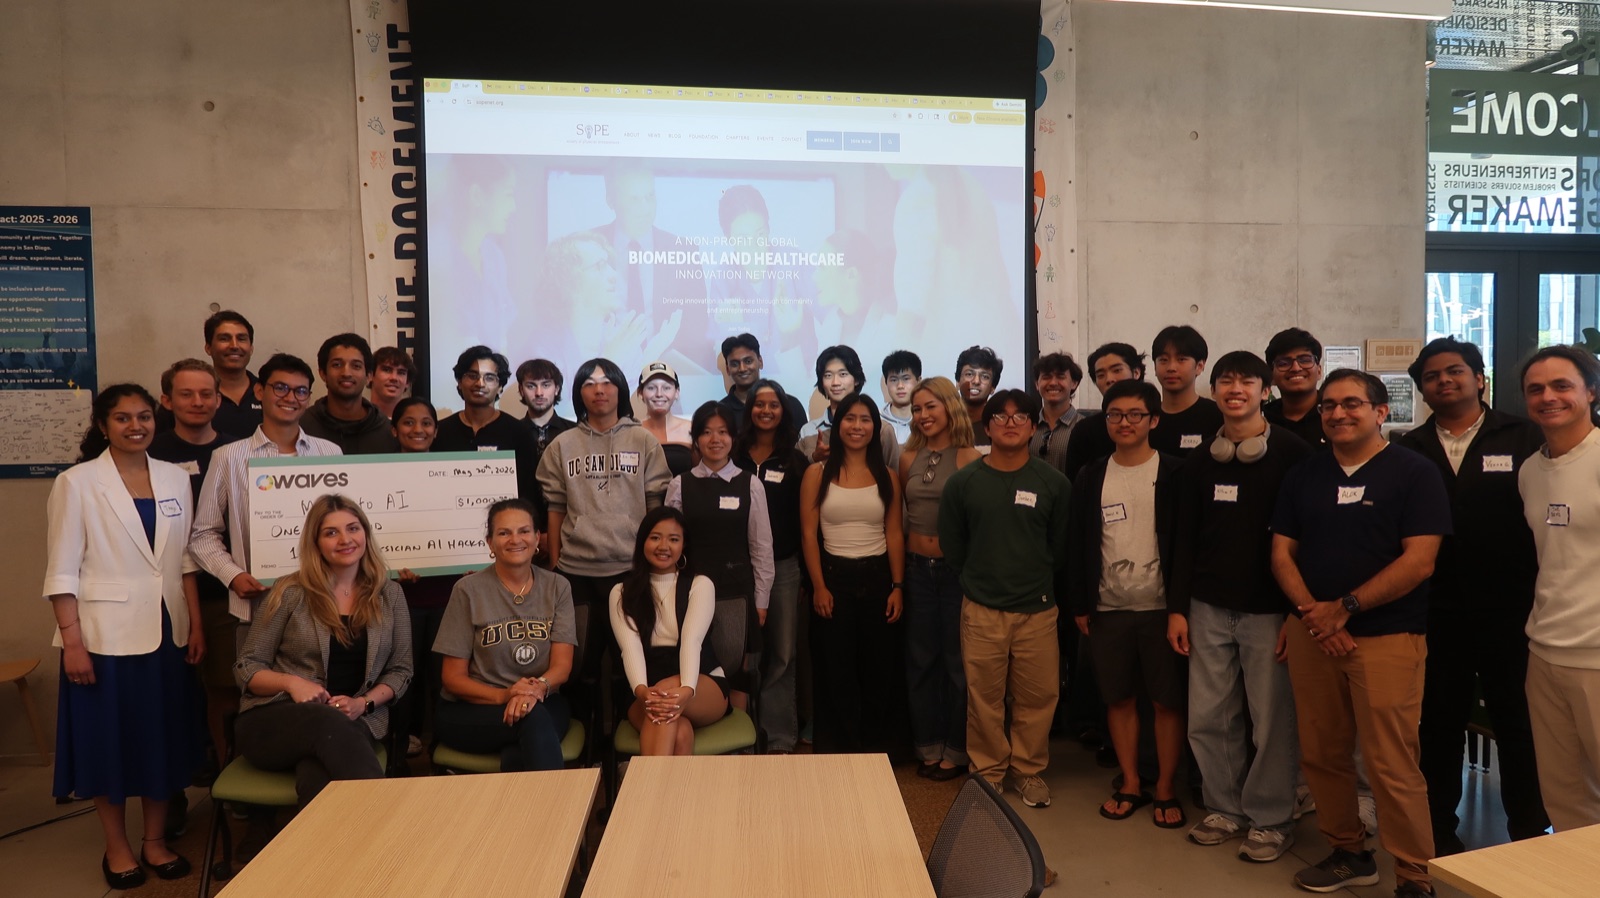
With the Society of Physician Entrepreneurs and Owaves, we put practicing physicians, industry engineers and UCSD students in one room to turn real clinical problems into working prototypes. About 50 participants, 2 keynotes and a $1,000 prize. I handled logistics, registrations and judge outreach. The winning team built Manifesto AI, a surgical-coordination prototype.

Participants, judges and organizers of the Physician-AI Hackathon posing with the prize check
The Physician-AI Hackathon, May 2026.

As president

Empowered engineering students to explore entrepreneurship and gain real-world experience.

  • Led the club in fostering a vibrant entrepreneurship culture at UCSD, connecting engineering students with industry experts, startups, and hands-on project opportunities.
  • Oversaw club operations, managed interdisciplinary projects, facilitated collaborations with other student organizations, and provided mentorship to help members develop entrepreneurial skills and execute innovative initiatives.
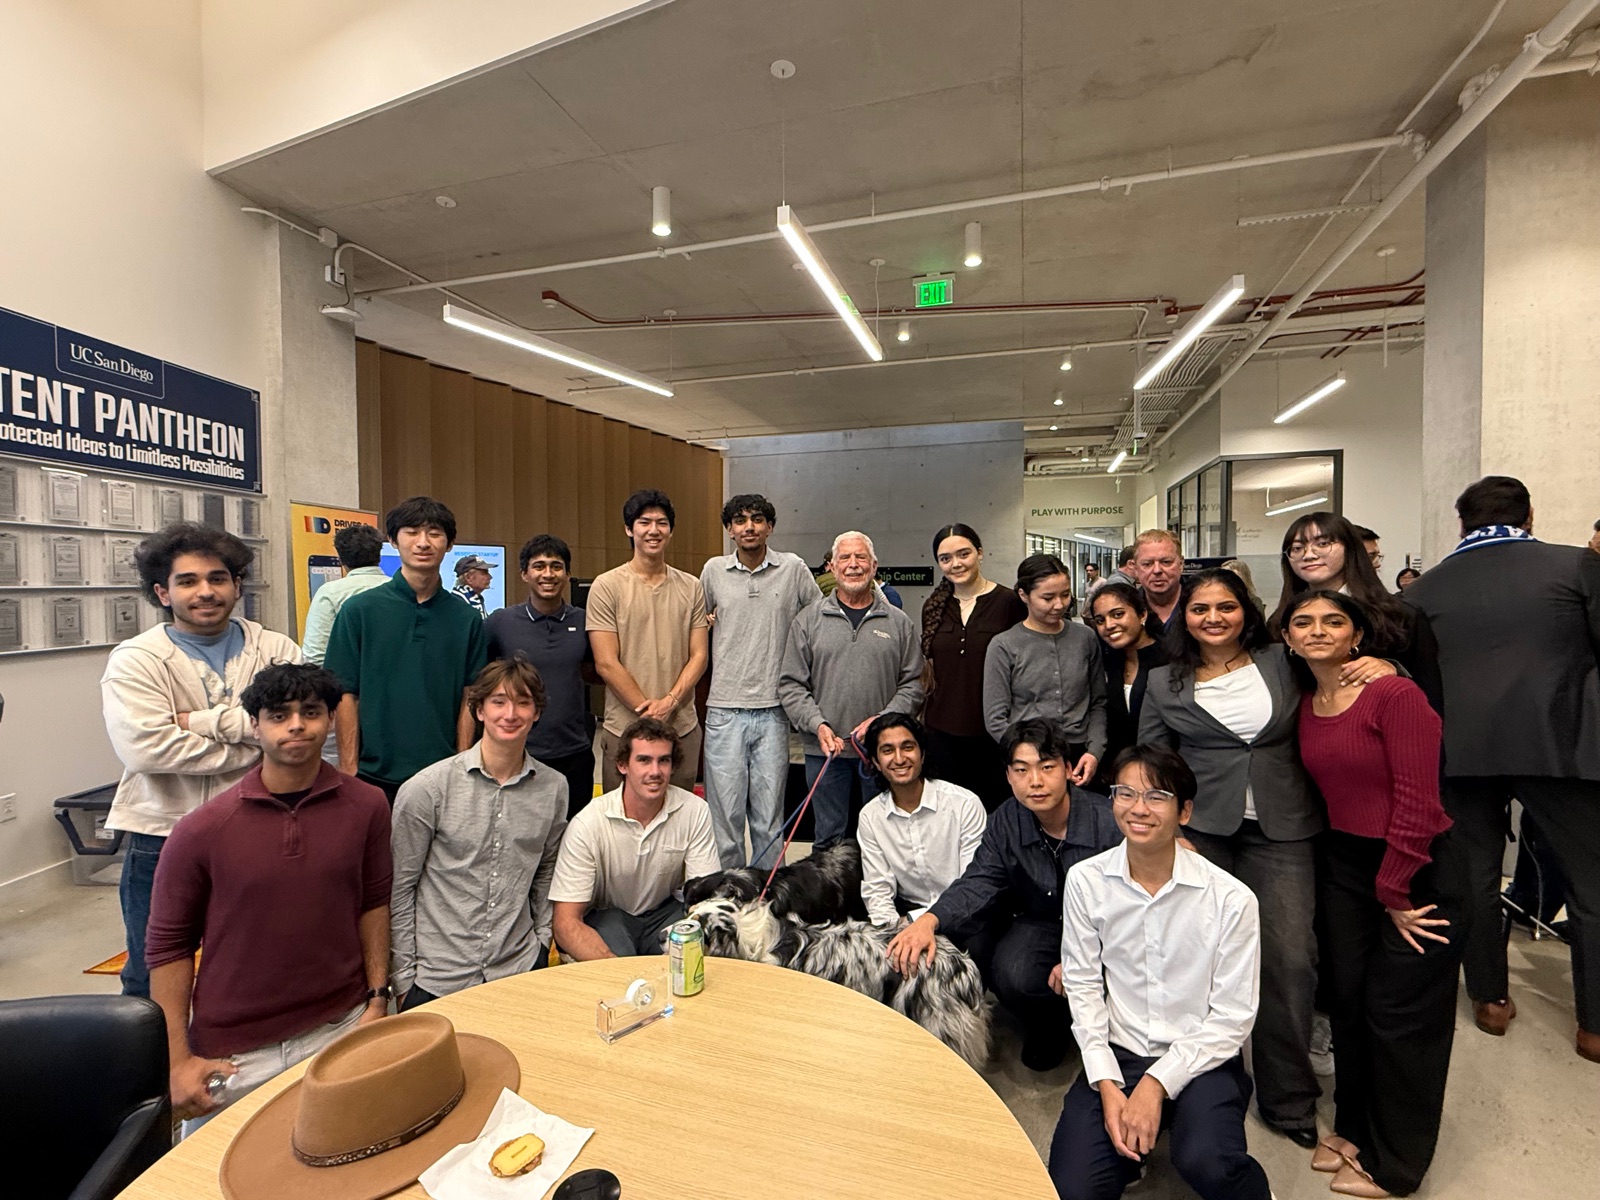
The fall 2025 QI x EIEC fellow cohort with mentors in UC San Diego's innovation space
The fall 2025 QI x EIEC fellow cohort.

ESG portfolio tools, research data and websites for a student-run investment group.

SIG is a student-led club focused on sustainable, long-term investing. Its Research & Development committee turns financial theory and ESG research into technical projects, centered on SIG's "ESG-efficient frontier" investment philosophy.

ESG portfolio optimizer

A team-built platform (8 contributors) that finds the best risk-adjusted portfolio for a target ESG score. Market and ESG data flow through a Prefect pipeline into an S3-style data lake, a cvxpy and SciPy optimizer traces Sharpe ratio against ESG score, and results are backtested and served through a FastAPI API and a Streamlit dashboard.

What else I did

  • Co-developed sigatucsd.org: built the research archive with live PDF previews, the first Sponsorship and Events pages, and the mobile layout.
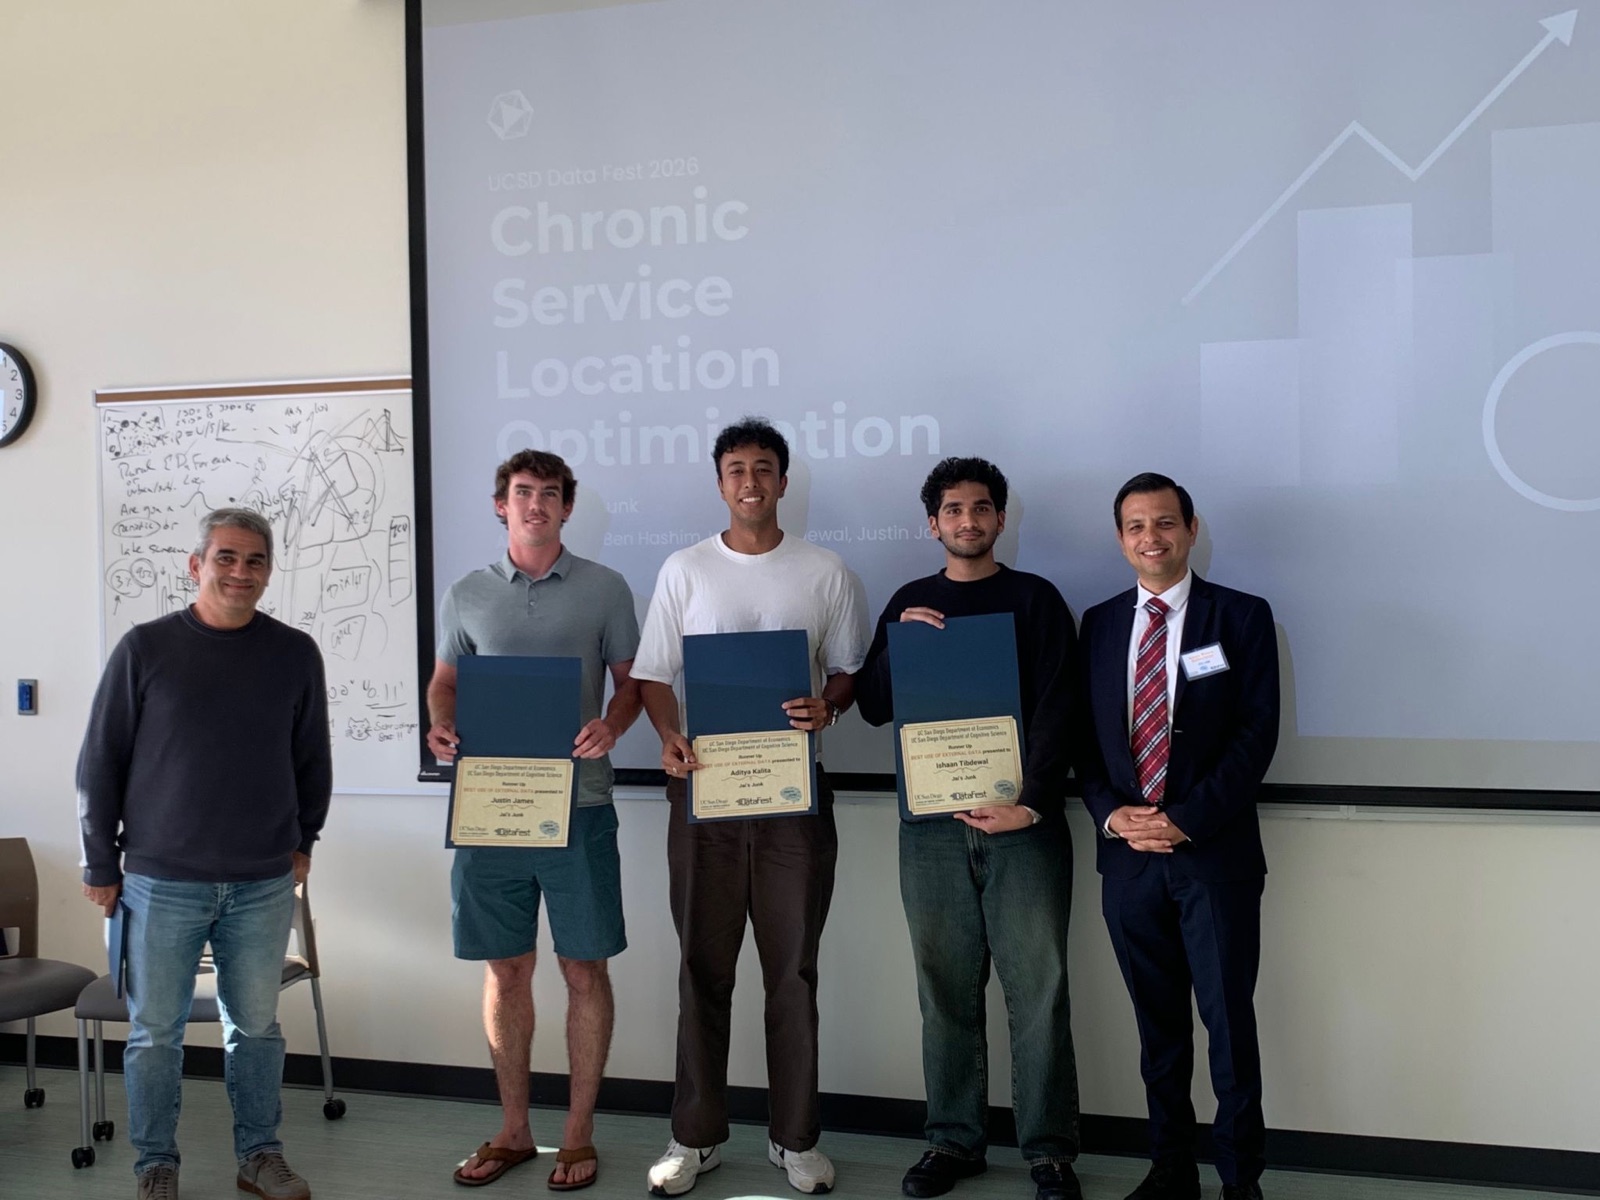
  • Competed with my team in UC San Diego DataFest 2026, which SIG co-organized, and placed 2nd for Best Use of External Data.
  • Built a structured ESG dataset for Costco (FY2016 to FY2026) from sustainability reports and third-party ratings to support SIG's ESG scoring research.

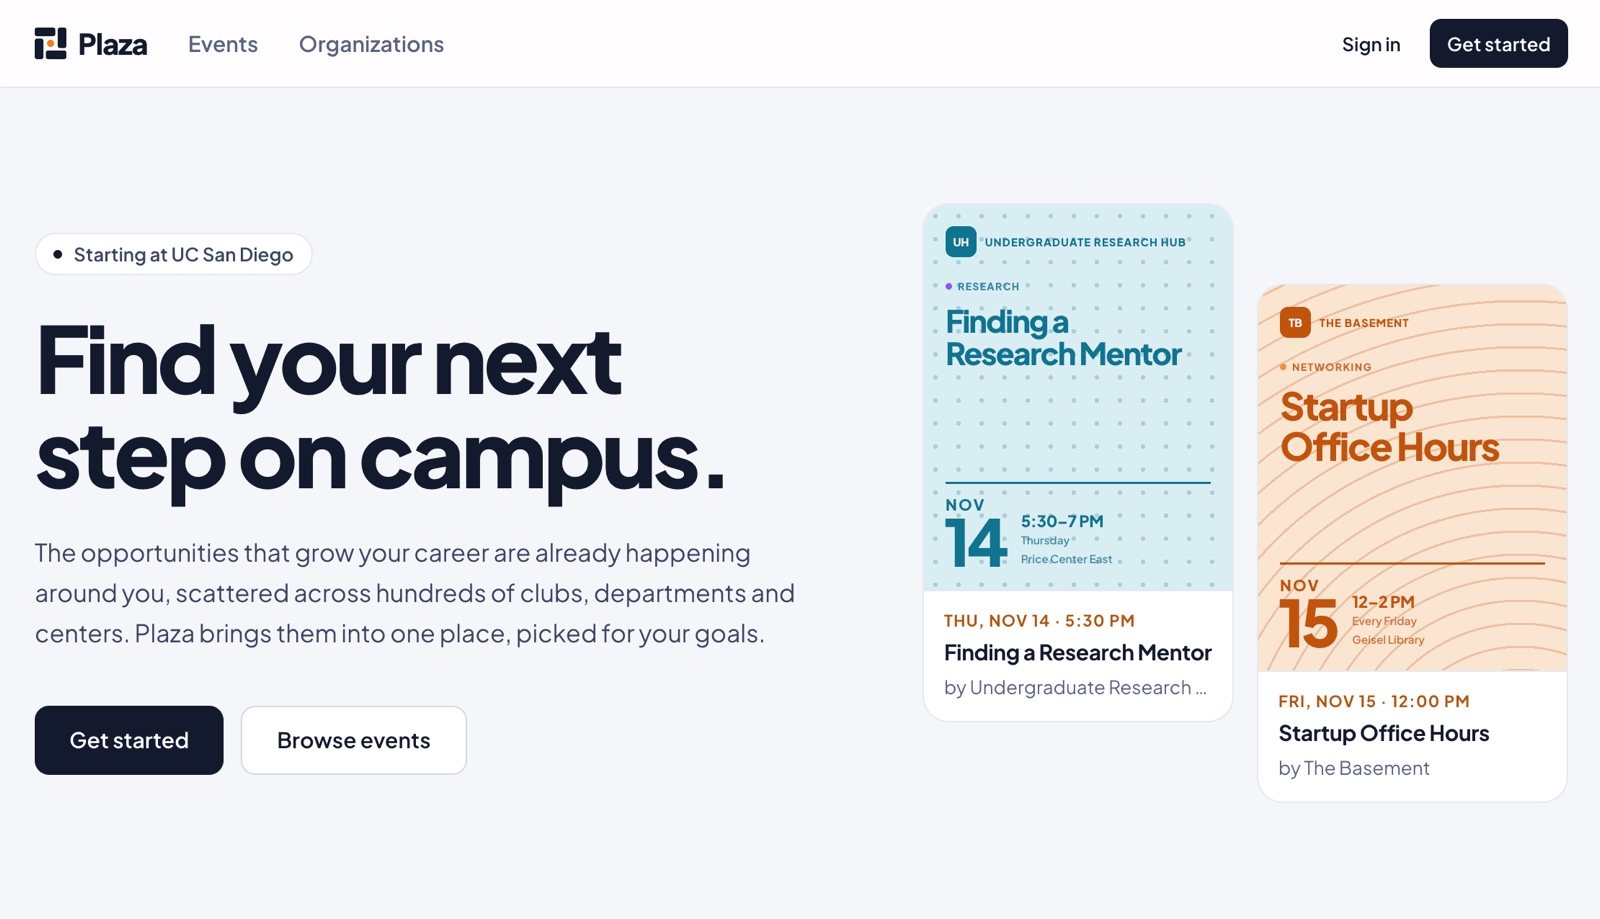
The front door to everything happening on campus: club events, workshops, speakers and opportunities from every department, in one place.

The opportunities that shape a student's path already happen on campus, but they're scattered across hundreds of clubs, departments and centers that don't talk to each other. Working in UC San Diego's innovation office, I kept hearing students say "I didn't know this existed."

The idea started in EIEC's Lab to Market program with the Qualcomm Institute. I built the first working version myself, then brought on a co-founder, and together we rebuilt it as a production web and mobile app, now live at UC San Diego.

Plaza's landing page: 'Find your next step on campus', with event cards for a research mentor workshop and startup office hours

Projects

Competitions, class work and things I built on my own.

Apr 2026 · UC San Diego DataFest

Where New Clinics Would Do the Most Good

2nd place, Best Use of External Data

In one weekend, my team of four analyzed 7.67M patient encounters from a regional health system. We grouped chronic patients by how their care unfolded over time, then used U.S. Census data to map the neighborhoods with the most risk.

Justin and two teammates holding their award certificates in front of the Chronic Service Location Optimization title slide, with two event organizers
How we did it
  • Cleaning. Joined six tables into an 8.1M-row master table, then kept about 701,000 chronic-care encounters.
  • Clustering. K-Means on 27-feature patient profiles sorted about 247K patients into 5 care-journey types, each with a 0 to 1 risk score.
  • Mapping. Linked patients to census block groups and mapped risk and patients per capita.

Risk was concentrated in specific neighborhoods around Topeka, the best targets for new clinics or outreach.

Team: Aditya Kalita, Ben Hashim, Ishaan Tibdewal and me.

  • Python
  • pandas
  • scikit-learn
  • Census data
  • Folium maps

2026 · DSC 80 class project

Predicting Restaurant Success in Hawaii

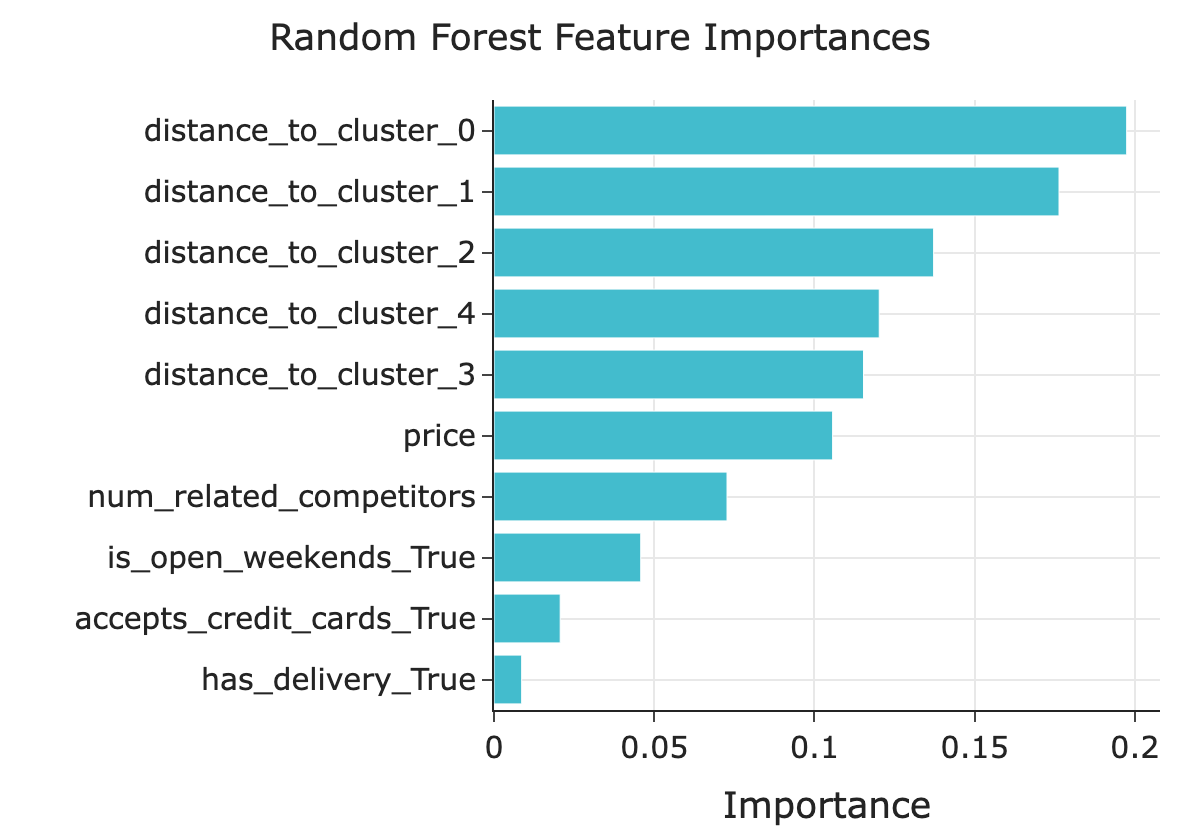
Solo project predicting a new restaurant's Google Maps rating from pre-opening choices like location, price and hours. A random forest with K-Means geographic clusters raised R² from 0.004 to 0.13. Location and price mattered most.

Bar chart of random forest feature importances: distances to the five geographic clusters rank highest, followed by price, competitor count, weekend hours, credit cards and delivery
  • Python
  • pandas
  • scikit-learn
  • K-Means
  • Plotly
View on GitHub ↗

Jul to Aug 2025 · Hermosa Beach

South Bay Chill

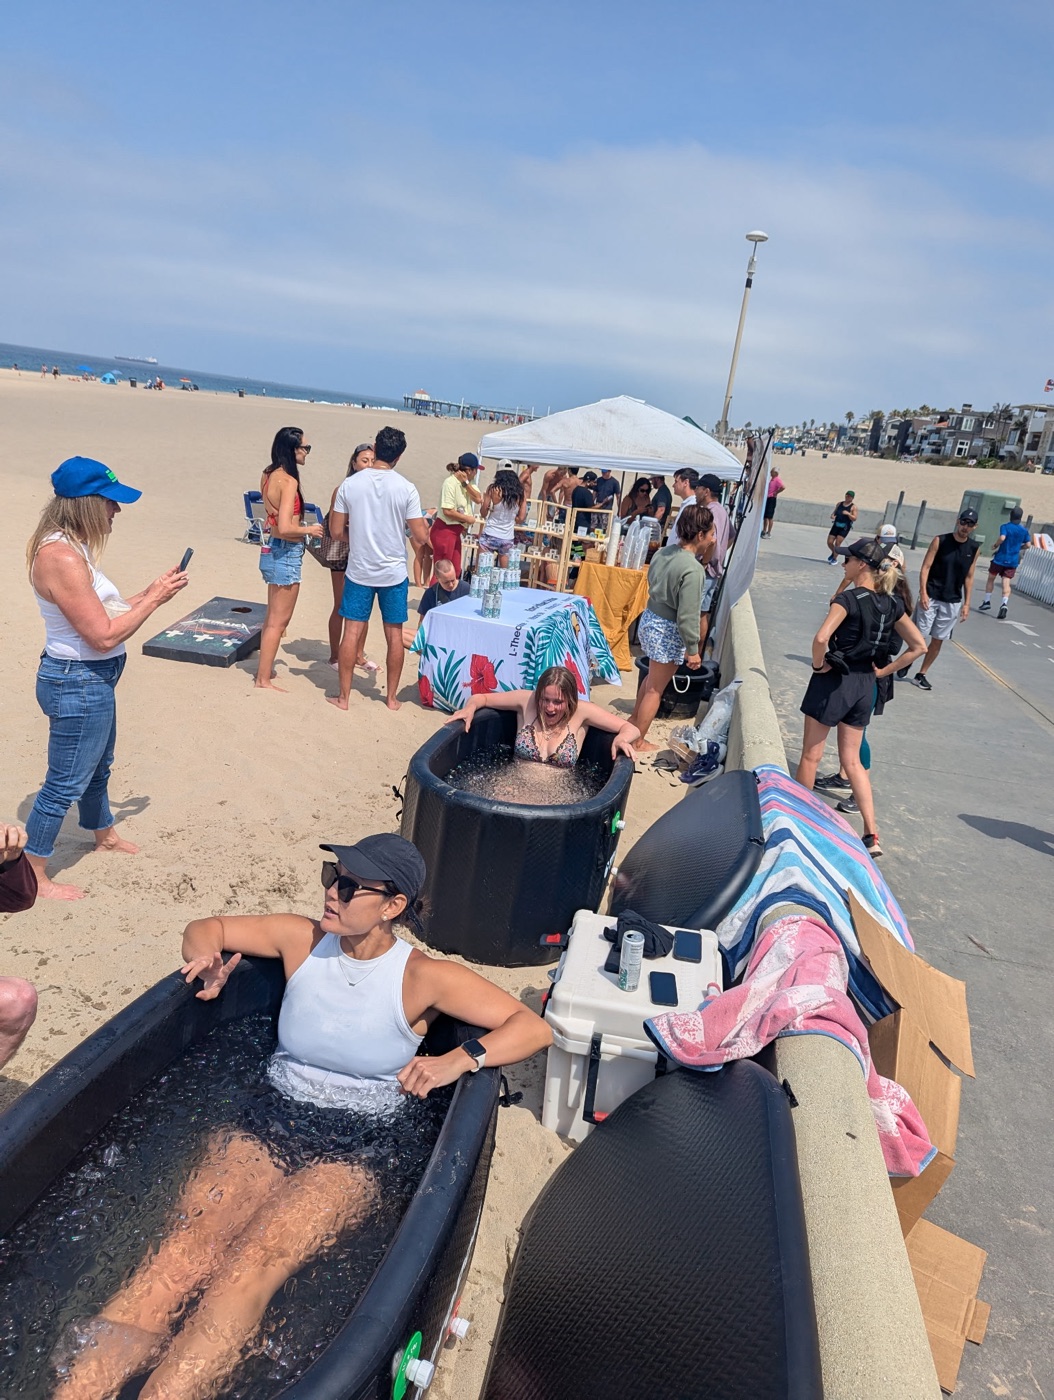
Founded a community wellness brand built around beach ice-bath events. I ran logistics, marketing and sales, and coordinated partners and sponsors.

A South Bay Chill event on Hermosa Beach: people sitting in ice baths on the sand by the boardwalk, with a crowd and a white event tent behind them
  • Founding
  • Events
See it on Instagram ↗